3x Mall Insights
Exploring the latest trends and news in online shopping.
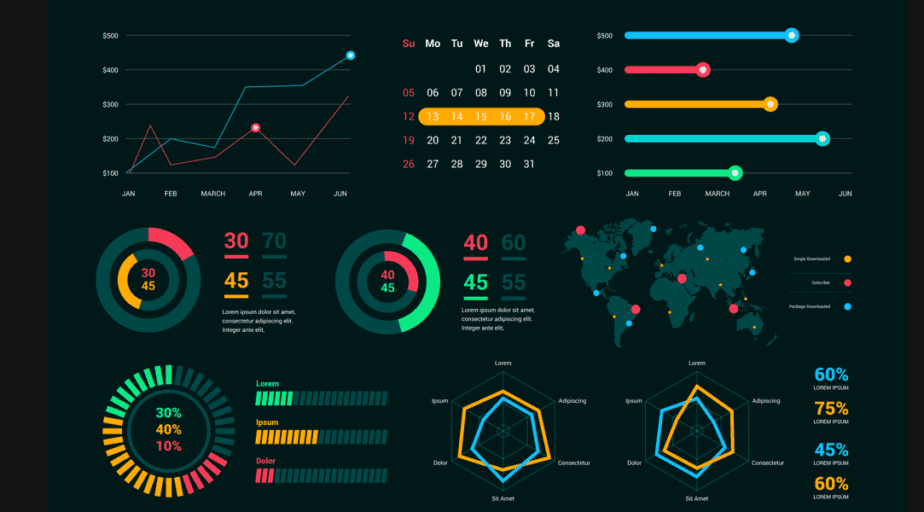
Doodles to Dashboards: Turning Raw Data into Eye Candy
Transform your raw data into stunning visuals! Discover how to turn your doodles into eye-catching dashboards that captivate and inform.
5 Steps to Transforming Raw Data into Stunning Visualizations
Transforming raw data into stunning visualizations involves a series of crucial steps that ensure clarity and engagement. The first step is to understand your data: familiarize yourself with its structure, types, and nuances. This foundational knowledge allows you to identify the key insights you want to highlight. Next, clean and preprocess the data by removing any inconsistencies or irrelevant information. This step can dramatically improve the quality of your visualizations, making them not only more accurate but also more impactful.
Once your data is clean, the third step is to choose the right visualization tools. There are various options available, from simple charting libraries to complex business intelligence platforms. The fourth step is to select appropriate visualization types based on your data's characteristics and the messages you wish to convey. For example, use pie charts for parts of a whole and line graphs for trends over time. Finally, always test and iterate on your visualizations, gathering feedback and making adjustments to optimize clarity and aesthetic appeal. By following these steps, you ensure that your visualizations not only present the data but also tell a compelling story.

The Art of Data Storytelling: How to Make Your Dashboards Pop
The art of data storytelling is crucial for creating compelling dashboards that not only present information but also resonate with the audience. To make your dashboards pop, it's essential to blend data visualization techniques with narrative elements. Start by identifying the story you want to tell with your data—whether it be trend analysis, performance metrics, or customer insights. Employ visual elements like charts, graphs, and infographics that highlight key takeaways and engage the viewer. Consistency in color schemes and clear labeling will also enhance readability and allow users to quickly grasp the story behind the numbers.
Another pivotal aspect of data storytelling is using context to guide your audience through the data narrative. Instead of overwhelming viewers with raw data, consider organizing your dashboard into
- Key Insights: Summarize the most critical findings.
- Supporting Data: Provide details that back up your insights.
- Actionable Recommendations: Suggest next steps based on the analysis.
Why Visualization Matters: Turning Complex Data into Clear Insights
Visualization plays a crucial role in transforming complex data into clear insights that are easily understood. By leveraging various graphical representations such as charts, graphs, and infographics, we can make sense of vast amounts of data that would otherwise be overwhelming. This not only aids in data interpretation but also enhances decision-making processes by allowing stakeholders to quickly grasp the key trends and patterns. In today's fast-paced digital world, where information overload is common, effective visualization techniques are essential for conveying important messages and facilitating strategic discussions.
Additionally, visualization fosters better retention of information. When data is represented visually, it engages the audience on a cognitive level, making it easier to remember key findings. Studies have shown that people process visuals significantly faster than text, often retaining more from the visual representation. As a result, organizations that employ strong visualization strategies are better equipped to guide their teams through complex datasets, helping them to identify opportunities and mitigate risks efficiently. Ultimately, investing in visualization not only clarifies data but also empowers teams to act decisively.